Lab 10: matplotlib
Logistics
- Due: Monday, July 1 no later than 5pm.
- Submission instructions: upload solution, entitled FirstName-LastNameLab10.py to the BrightSpace Lab 10 Dropbox.
- Deadline reminder: once this deadline passes, BrightSpace will no longer accept your Python submission and you will no longer be able to earn credit. Thus, if you are not able to fully complete the assignment, submit whatever you have before the deadline so that partial credit can be earned.
Learning outcomes
- Gain experience with matplotlib to display information.
- Continue to gain experience with numpy.
Background
- The Registrars Office at Montana State University makes various enrollment statistics available.
- The file fall-2018.csv captures some of the information that is available in the Fall 2018 Report G - Part A: Headcount Enrollment, All Students by Primary Major. The first line contains how many lines of data follow. Each subsequent line contains the name of one of MSU’s colleges (such as CLS for the College of Letters & Science) followed by the Fall 2018 enrollment for that college.
Assignment
- Use lab10.py, renamed according to the instructions above, as a starting point.
- The
read_filefunction should return (1) a numpy array that contains each college name and (2) a corresponding numpy array that contains each college’s enrollment. - The
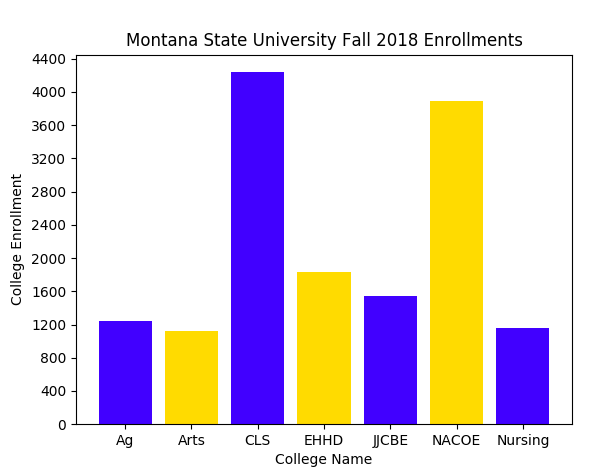
mainfunction should produce the desired bar graph using the information contained in the numpy arrays namedcollege_namesandcollege_enrollments. - Write a program that matches this graph as closely as possible. Hint: check out the matplot.pyplot.bar documentation.
Grading - 10 points
1 point - The chart it titled “Montana State University Fall 2018 Enrollments”.
1 point - The x-axis is labeled College Name and the y-axis is labeled College Enrollment.
1 point - The y-axis goes from 0 to 4400 in increments of 400.
1 point - The x-axis contains the same college names that appear in the input file.
2 points - The bar graph reflects the data in the file accurately.
1 point - The colors of the bars in the bar graph alternate between “blue” and “gold”.
2 points - The function read_file returns (1) one numpy array that contains the names of the colleges and (2) a second numpy array that contains the enrollments of the colleges.
1 point - The bar graph is created and plotted entirely in the main function.
Grading turnaround
All labs graded with scores recorded in BrightSpace no later than lab time (2pm) the following day.